The 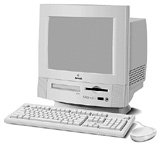 Power Macintosh 5200 was released in April
1995 as the first all-in-one Power Mac design. Like the modular 6200,
the 5200 runs a PowerPC 603 CPU at 75 MHz. During the life of the x200
series, Apple used several revisions of the motherboard for both
domestic and overseas models. The unit tested had the XXXXX
motherboard.
Power Macintosh 5200 was released in April
1995 as the first all-in-one Power Mac design. Like the modular 6200,
the 5200 runs a PowerPC 603 CPU at 75 MHz. During the life of the x200
series, Apple used several revisions of the motherboard for both
domestic and overseas models. The unit tested had the XXXXX
motherboard.
The computer was received with 12 MB RAM and Mac OS 7.6.1 installed.
We found that was too little memory for testing the computer with
virtual memory off, so we increased physical memory to 36 MB.
Remember that benchmarks are arbitrary. They measure certain types
of performance that may or may not reflect the way you work.
Virtual memory was tested, but the difference in scores was
insignificant, as much because of Apple's improvements in running
virtual memory as the fact that none of these benchmark programs pushed
the system to the point where it needed more memory than was
installed.
Speedometer 3.06
This computer was not tested with Speedometer 3.
Speedometer 4.02
The systems were tested on 9 September 2001 using Mac OS 7.6.1 with
the normal complement of extensions. No third-party software was added.
We used the internal 15" multisync monitor and tested in 8-bit video
mode at 832 x 624 resolution. Results are relative to a Quadra 605,
which rates 1.0. Numbers rounded off to one or two decimal places.
We were unable to run the graphics benchmark, since the 5200 doesn't
support 1, 2, or 4 bit video.
These scores compare performance with virtual memory off and
different sizes of disk cache.
cache      CPU    disk     math
  96K     3.59    1.53    127.6
 128K     3.59    1.53    127.8
 256K     3.57    1.58    126.5
 512K     3.59    1.60    127.7
1024K     3.58    3.86    127.5
2048K     3.59    4.22    127.5
The closest machine we can compare this with is the Power Mac
6100/66, which produced the following results with Mac OS 8.6 and a 1.2
MB disk cache. Not too comparable a configuration, but that's the way
we tested it.
model      CPU    disk     math
no cache  3.40    1.54    116.5
256K L2   3.43    1.73    118.4
This 5200 is just 5.6% faster than a cacheless 6100/66, and only
4.7% faster than the 6100 with a 256K L2 cache. If the 603 and 601 were
equally efficient processors, you'd expect a 13-14% improvement. Since
the 603 is supposed to be an improvement on the 601, this tells us
something is wrong.
Math performance fares a bit better, with the 5200 outperforming the
cacheless 6100 by 9.6% and the cached 6100 by 7.8%. Again, this is less
than we would expect based on the MHz difference.
The 5200 uses an IDE hard drive, which provides decent performance
in this test. Because of the larger disk cache on the 6100, it wouldn't
be fair to compare the two machines for disk performance.
Virtual Memory
Our next test was to set virtual memory to 37 MB and run benchmarks.
According to the technical information on the x200 series, virtual
memory should be detrimental to system performance. Here are our
results:
cache      CPU         disk          math
 128K     3.59         1.53         127.8
VM/128K   3.57 -0.5%   1.49 -0.2%   126.2 -1.3%
 256K     3.57         1.58         126.5
VM/256K   3.56 -0.0%   1.55 -2.1%   126.0 -0.3%
 512K     3.59         1.60         127.7
VM/512K   3.56 -0.8%   1.60 -0.0%   126.5 -0.9%
Speedometer 4 does detect a performance penalty with VM on, but it
doesn't measure it as a very large penalty. Similar tests under
MacBench 5 show a more significant reduction in hard drive
performance.
SCSI
Believe it or not, our tech article on the x200 series says that
simply terminating the SCSI bus improves system throughput,
particularly for networking. We'll report on network throughput
elsewhere, but we did some testing with a terminated SCSI bus (using a
standard 25-50 pin SCSI cable and a terminator) and with a terminated
SCSI hard drive attached. We only benchmarked disk performance and only
with a 256K disk cache. We used the SCSI drive for Virtual Memory:
Virtual Memory   IDE drive   SCSI drive
base               1.583        n/a
on, SCSI drive     1.555       1.872
off                1.565       1.912
We are comparing apples and oranges here - the SCSI drive is
obviously a faster mechanism. Results of this test don't show an
appreciable difference whether there is a device on the SCSI bus or
not.
Different Operating Systems
We partitioned the external Quantum Fireball 2.1 GB hard drive into
five partitions. The first (100 MB) was dedicated for use under virtual
memory. The other partitions were used for System 7.5.5, Mac OS 7.6.1,
8.1, and 8.6. All tests were performed with the disk cache manually set
to 256K for the sake of consistency. Hard drive performance was
measured on both the internal IDE hard drive and the second partition
on the external SCSI drive.
OS/VM          CPU     IDE    IDE+    SCSI    HFS+     math
7.5.5/off     3.56    1.60    ----    1.95    ----    126.4
7.5.5/on-1    3.57    1.58    ----    1.89    ----    126.6
7.5.5/on-2    3.57    1.59    ----    1.90    ----    126.6
7.6.1/off     3.57    1.58    ----    1.91    ----    126.5
7.6.1/on-1    3.56    1.55    ----    ----    ----    126.0
7.6.1/on-2    ----    1.56    ----    1.87    ----    126.0
8.1/off       3.57    1.36    ----    2.04    2.08    126.6
8.6/off
9.1/off

on-1 = VM on IDE drive, on-2 = VM on SCSI drive
IDE+ is an HFS+ partition on the internal IDE drive
HFS+ is an HFS+ partition on the external SCSI drive
MacBench 5
This systems was tested on 9 September 2001 using Mac OS 7.6.1 with
the normal complement of extensions. No third-party software was added.
We used the internal 15" multisync monitor and tested in 8-bit video
mode at 832 x 624 resolution. Results are relative to a Power Mac
G3/300 (beige), which rates 1000. Numbers rounded off to two decimal
places.
I also tested the 6100/60 with 256 KB L2 cache on 22 November 1999.
The only other difference was a 832 x 624 monitor, which also let me
run the graphics benchmark.
cache    CPU   math   disk
  92K     88    122    173
 128K     89    118    187
 256K     98    133    209
 512K     88    121    217
1024K     88    128    231
2048K     98    133    243
For comparison, results from a Power Mac 6100/66 tested under Mac OS
8.6 and a 1.2 MB disk cache, both with and without a 256k level 2
cache.
model       CPU  math
6100/66     112   177
w/256L2     135   192
Under MacBench 5, the 5200 actually scored lower than the 6100,
where the difference in MHz alone would lead us to expect a 13-14%
improvement. Likewise, math scores are significantly lower. This
reflects the kind of real world disappointment people experienced with
the 75 MHz 5200 and 6200 - they had expected it to outperform the 6100,
but it tended to offer similar real world performance.
One peculiarity is the way the CPU and math scores with the 256K and
2MB disk caches were the highest obtained, identical to each other, and
generally about 10% higher than at other cache settings.
We also have results from a faster machine based on the improved
version of the 603. The SuperMac C500 was benchmarked with both a 200 and 240 MHz 603e CPU. It
was also set up with Mac OS 7.6.1, just like the 5200. Here are the
results:
speed      CPU   math   disk
200 MHz    273    383    607
240 MHz    293    424    623
We would expect the CPU and math scores at 200 MHz to be 2-2/3 times
as high as the 75 MHz 5200 - and we come pretty darn close. Likewise,
we would expect 240 MHz results to be 3.2x as high as the 5200, and
they again come quite close.
Virtual Memory
Our next test was to set virtual memory to 37 MB and run benchmarks.
According to the technical information on the x200 series, virtual
memory should be detrimental to system performance. Here are our
results:
cache     CPU       math       disk
 128K     89         118        187
VM/128K   89         119 +0.8%  178 -4.8%
 256K     98         133        209
VM/256K   87 -11.2%  133        197 -5.7%
 512K     88         121        217
VM/512K   99 +12.5%  128 +5.8%  201 -8.0%
Hard drive performance definitely suffers with virtual memory
enabled. Suprisingly, CPU performance is at its peak with VM on and a
512K disk cache.
SCSI
Our tech article on the x200 series says that simply terminating the
SCSI bus improves system throughput, especially for networking. We'll
report on network throughput elsewhere, but we did some testing with a
terminated SCSI bus (using a standard 25-50 pin SCSI cable and a
terminator) and with a terminated SCSI hard drive attached. For this
test, we used the SCSI drive for virtual memory. We only benchmarked
disk performance and only with a 256K disk cache:
Virtual Memory   IDE drive   SCSI drive
base                209         n/a
on, SCSI drive      197         253
off                 209         269
We are comparing apples and oranges here - the SCSI drive is
obviously a faster mechanism. Results of this test don't show an
appreciable difference whether there is a device on the SCSI bus or
not.
Different Systems
We partitioned the external Quantum Fireball 2.1 GB hard drive into
five partitions. The first (100 MB) was dedicated for use under virtual
memory. The other partitions were used for System 7.5.5, Mac OS 7.6.1,
8.1, and 8.6. All tests were performed with the disk cache manually set
to 256K for the sake of consistency. Hard drive performance was
measured on both the internal IDE hard drive and the second partition
on the external SCSI drive.
OS/VM          CPU     math     IDE    IDE+    SCSI    HFS+
7.5.5/off       98      128     209     ---     262     ---
7.5.5/on-1      98      132     199     ---     259     ---
7.5.5/on-2      98      122     200     ---     260     ---
7.6.1/off       98      133     209     ---     269     ---
7.6.1/on-1      87      133     197     ---     ---     ---
7.6.1/on-2      -      ---     197     ---     253     ---
8.1/off         92      160     194     ---     252     n/a
8.6/off
9.1/off

on-1 = VM on IDE drive, on-2 = VM on SCSI drive
IDE+ is an HFS+ partition on the internal IDE drive
HFS+ is an HFS+ partition on the external SCSI drive
Go to 5200
profile.